
Most electric railway traction systems rely on Overhead Line Equipment, commonly referred to as OLE or OHL. The overall infrastructure may also be referred to as an Overhead Catenary System, or OCS.
Within this infrastructure, one of the key components for diagnostic purposes is the contact wire, also known as the trolley wire. Since it is the interface between the overhead line and the pantograph, the contact wire is one of the primary targets for OCS diagnostics.
ADTS develops OHL diagnostic systems for the optical measurement of the main contact wire geometrical parameters, primarily contact wire height and stagger.

Height and stagger
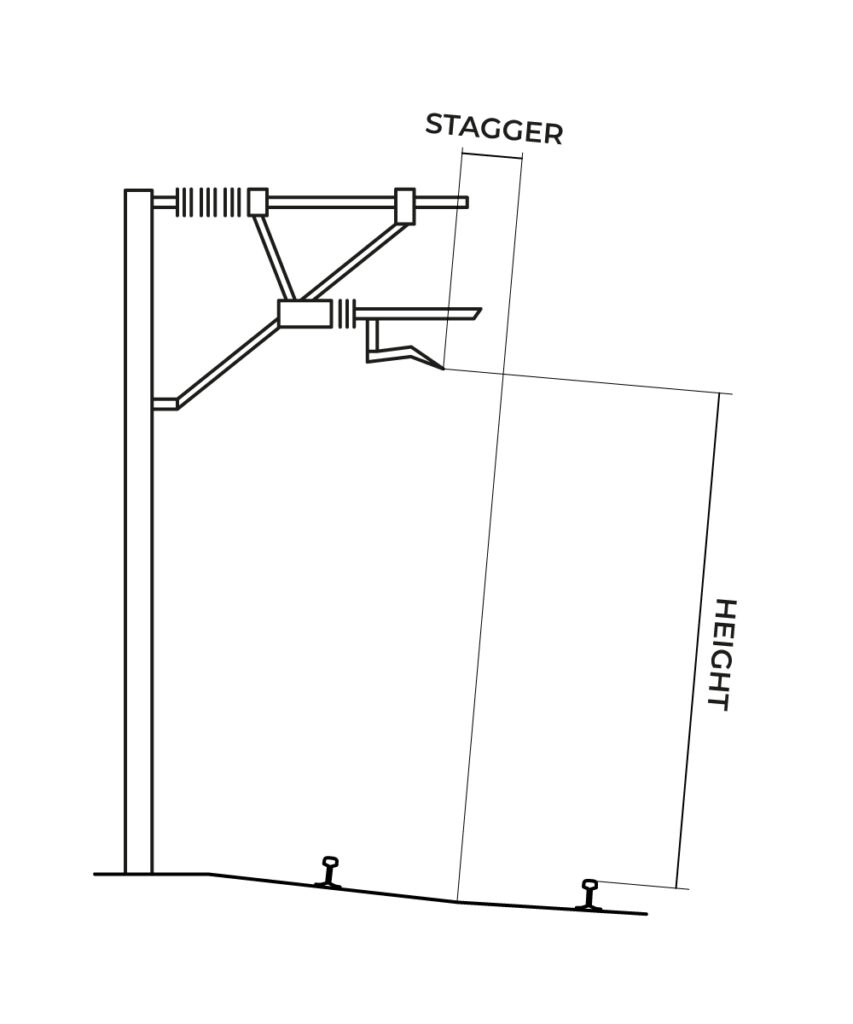
Height and stagger are the primary geometrical parameters measured by an OHL diagnostic system such as the ADTS Catenary Measurement System.
These parameters describe the position of the contact wire in the transverse plane of the track. The reference system is typically defined with respect to the rail plane and the track centreline.
Contact wire height is the vertical distance between the contact wire and the rail plane, while contact wire stagger is the lateral displacement of the contact wire with respect to the track centreline.
The optical detection of the contact wire position is therefore the basis for further diagnostic evaluations, including indirect wear assessment methods.
Wear Measurement by Laser Triangulation
Once the contact wire position has been measured in terms of height and stagger, a further diagnostic aspect can be considered: contact wire wear.
Wear assessment is more complex than position measurement, because it does not only require the detection of the wire location, but also the evaluation of the worn geometry of the contact area.
One possible approach is to use a laser triangulation system. In this case, a laser line is projected onto the contact wire and one or more cameras acquire the reflected profile. Based on the triangulation geometry, the system can reconstruct the section profile of the wire and compare it with the nominal design profile.
By reconstructing the wire shape, it is possible to identify the actual wear pattern and to measure the difference between the original wire geometry and the worn condition.
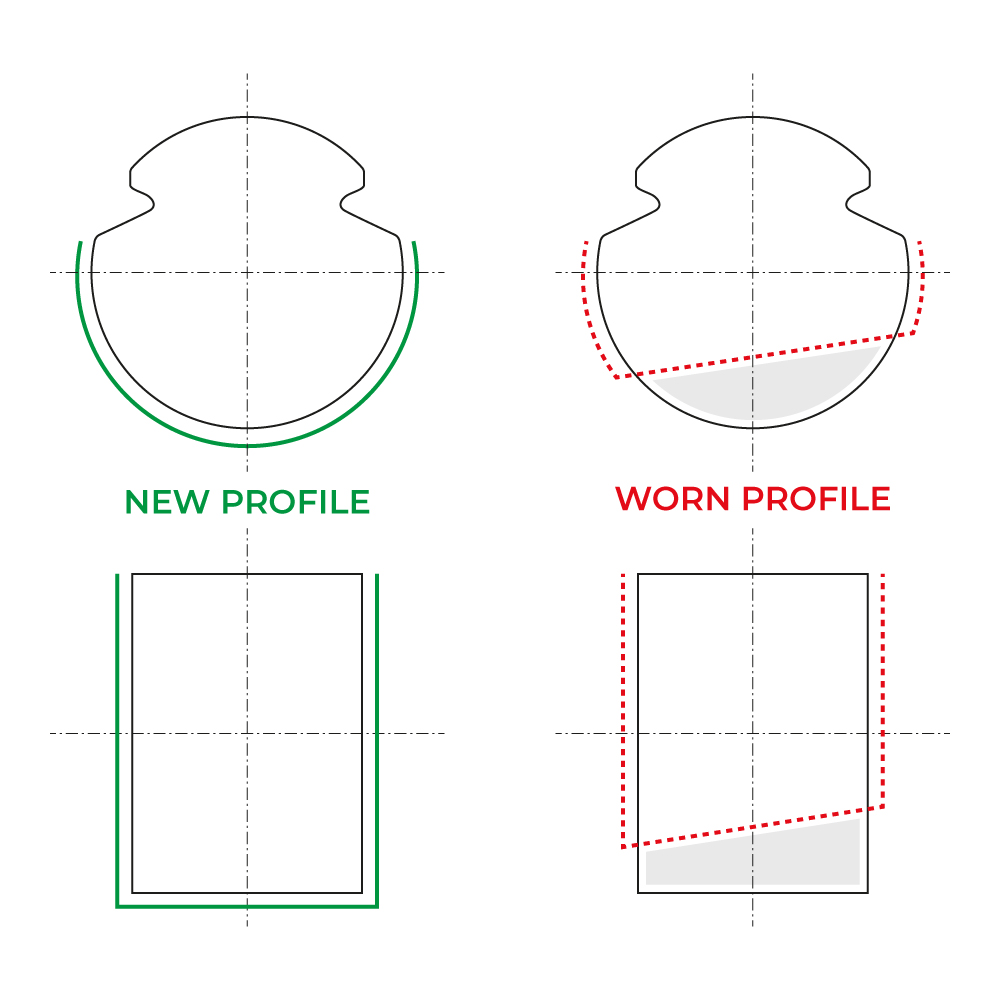
Laser triangulation therefore provides a direct evaluation of the contact wire profile and can deliver high measurement accuracy. However, this approach also has some important drawbacks.
The required Field of View, is significant because the system must be able to detect the contact wire within its possible range of positions. At the same time, the system must provide high resolution in order to measure small variations in the wire profile. This combination makes laser triangulation systems relatively expensive.
Moreover, laser triangulation may require high-energy laser sources, especially when the system has to operate at a significant distance from the contact wire and under different lighting conditions, including bright daylight.
As a consequence, laser safety becomes a relevant design constraint. Depending on laser power, wavelength, beam divergence, installation geometry and exposure conditions, the Nominal Ocular Hazard Distance, or NOHD, may become significant.
For example, if an OHL diagnostic system is installed on the roof of a train and uses lasers with an NOHD greater than 10 m, a potential ocular hazard may exist for people standing on a bridge above the track while the train is passing underneath.
Wear Estimation by Flat Surface Reflection
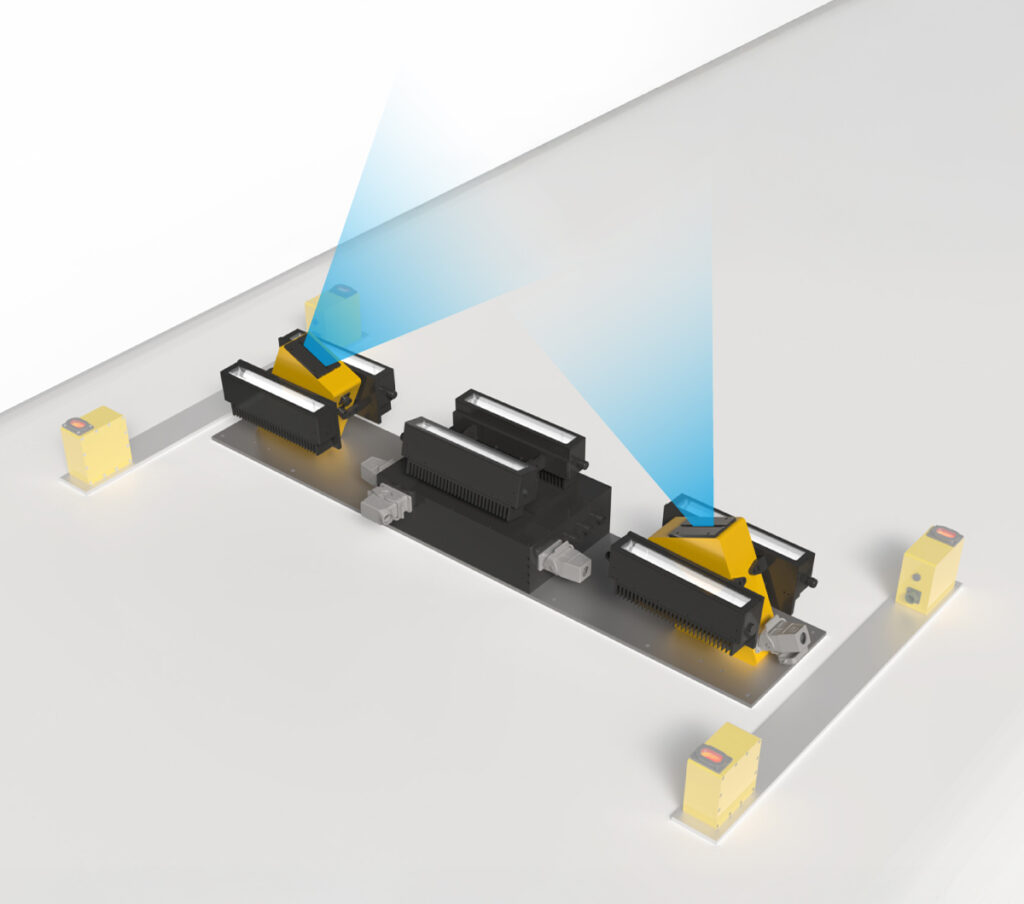
An alternative approach for evaluating contact wire wear is based on flat surface reflection. This method does not reconstruct the complete section profile of the wire. Instead, it detects the reflective flat surface generated by the mechanical contact between the pantograph and the contact wire.
The method can be implemented using LED illumination and cameras. The LEDs illuminate the lower part of the contact wire, while the cameras acquire the reflected light from the worn flat surface. By processing the acquired images, the system can identify the reflective area and estimate its width.
Since the system already detects the contact wire position for height and stagger measurement, the same optical acquisition concept can be used to associate the reflective flat surface with the corresponding contact wire position. The width of this reflective surface can then be used as an indirect indicator of contact wire wear.
For contact wires whose lower contact area can be approximated by a circular arc of known radius, the reflective flat surface can be modelled as a chord of the original circular profile.
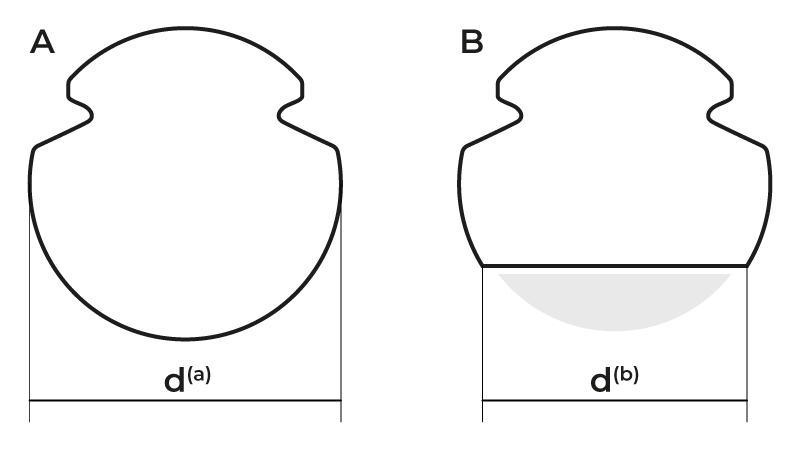
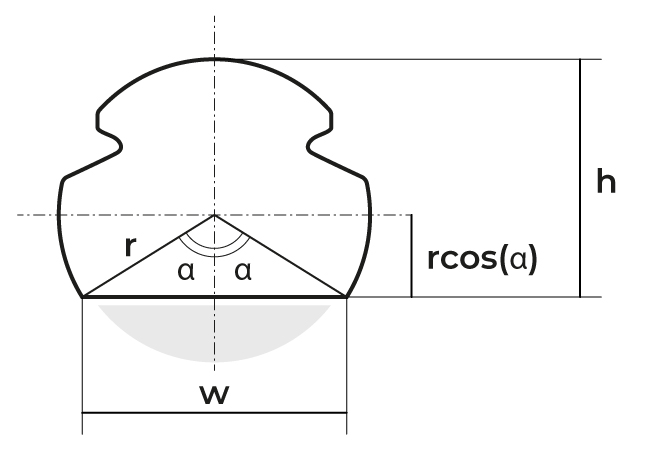
Under this assumption, the wear depth corresponds to the sagitta of the circular segment.
For a wire with radius r, the angle α can be calculated as: α = arcsin(w / 2r)
The worn depth can then be calculated as: wear = r − r · cos(α) or wear = r(1 − cos α)
This method is attractive because it can be integrated with the height and stagger measurement approach. In addition, since it can rely on LED illumination, it avoids the laser safety issues associated with triangulation systems.
The main advantage of this approach is therefore the possibility to reduce the overall system cost.
However, this method is subject to important technical limitations, which must be considered carefully.
Technical Limitations of the Wear Reflection Method
Although the flat surface reflection method is effective for indirect wear estimation and classification, there are some technical aspects that must be considered for a complete and fair analysis.
Unlike laser triangulation, which can reconstruct the actual section profile of the contact wire, the reflection-based method evaluates wear indirectly through the detected reflective surface. Therefore, it may not provide reliable information in the case of uneven, asymmetric or localized wear.
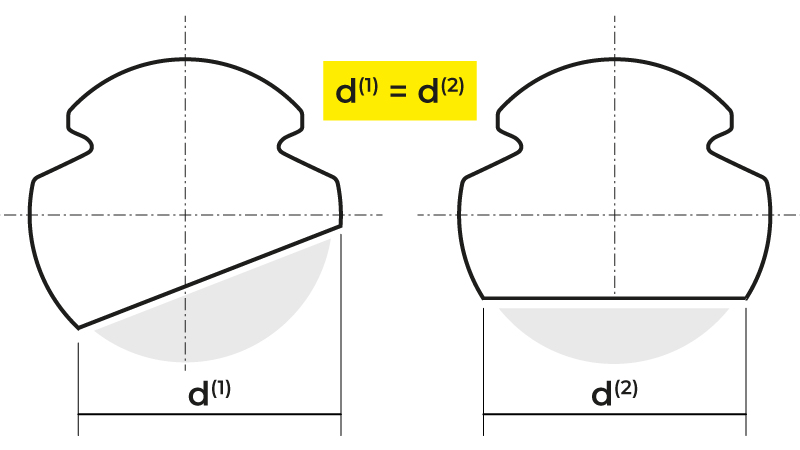
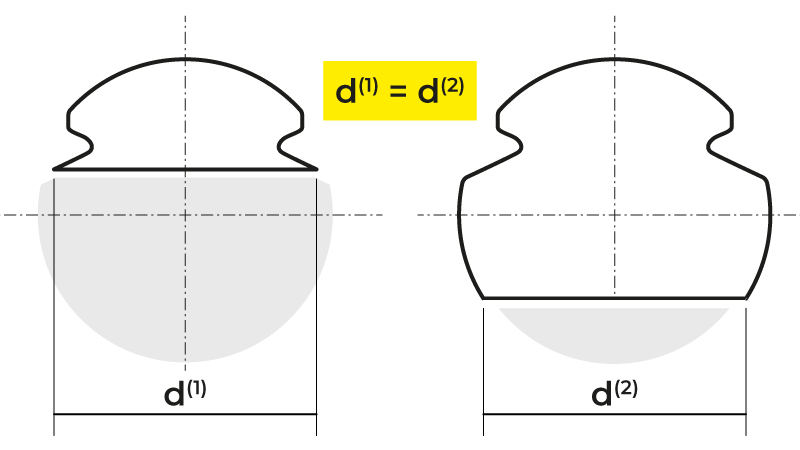
A further limitation is related to the circular geometry assumption. Different reflective surfaces may have the same distance from the geometrical centre of the wire, making them difficult or impossible to distinguish using reflection alone.
Moreover, the measurement of the reflective surface depends on the correct identification of its boundaries. These boundaries may be affected by thermal effects caused by current flow, electrical arcs, sparks, oxidation, surface marks, or other events that occurred during the service history of the wire.
As a consequence, the limits of the reflective area may not always be well defined or predictable.
Another important aspect is the error propagation in the wear calculation. The uncertainty of the calculated wear is linked to the wear value itself. As the wear approaches the wire radius, the angle α approaches 90°. In this region, the trigonometric relationship becomes more sensitive, and small errors in the measurement of the reflective width w may generate larger errors in the calculated wear.
This means that the system is highly accurate when wear is limited and therefore less critical. However, its accuracy decreases as the wear approaches the wire radius, precisely when the measurement becomes more critical.
Example of Error Propagation
The following example refers to a contact wire with a diameter of 14 mm, corresponding to a radius of 7 mm.
Wire Diameter | Ground Truth Wear | Reflective Width Measurement Error | Wear Measurement Error |
14 mm | 2.0 mm | ±0.5 mm, 2σ | ±0.25 mm, 2σ |
14 mm | 4.0 mm | ±0.5 mm, 2σ | ±0.55 mm, 2σ |
14 mm | 5.0 mm | ±0.5 mm, 2σ | ±1.00 mm, 2σ |
14 mm | 5.1 mm | ±0.5 mm, 2σ | ±1.10 mm, 2σ |
14 mm | 5.1 mm | ±0.2 mm, 2σ | ±0.36 mm, 2σ |
It should be noted that the wear estimation error approximately doubles when the actual wear increases from 4 mm to 5 mm.
This confirms that the reflection-based system is more accurate when the wear level is low, while its error performance decreases when the wear becomes closer to the wire radius.
In the last case, an error of only ±0.2 mm on the reflective width w has been assumed. If the relevant reflective width is approximately 13.5 mm, the image should provide at least: 13.5 / 0.2 ≈ 70 pixels across that width.
Considering a safety factor of two, the required spatial resolution would be approximately: 140 pixels over 13.5 mm which corresponds to about: 10 pixels/mm
This shows that the image acquisition system must provide sufficient spatial resolution in order to achieve reliable wear estimation, especially in high-wear conditions.
It is also important to specify whether the measurement error is expressed as 1σ or 2σ.
A 2σ error interval covers approximately 95% of the expected values, while a 1σ interval covers only about 68%. Therefore, 1σ and 2σ error figures should not be compared directly.
Conclusion
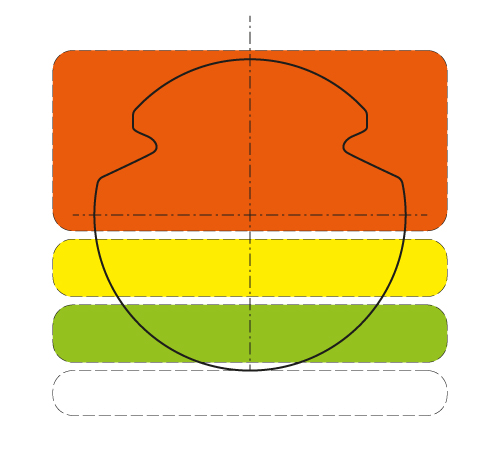
For all the reasons described above, we consider the wear reflection method suitable mainly for wear classification, rather than for actual wear measurement as performed by a triangulation-based system.
By classification, we mean a diagnostic description of the contact wire condition, such as:
- severely worn wire — red zone.
- worn wire — yellow zone;
- initially worn wire — green zone;
- new wire — white zone;
The reflection method can therefore provide useful information about the wear status of the contact wire, but it should be considered as a classification approach rather than a direct profile-based measurement method.